Several
hours per deck
The time needed to turn a KPI spreadsheet into a brand-compliant deck is rarely measured precisely — yet formatting, charts, and commentary easily absorb half a day to a full day per report.
Every quarter, your finance, sales, and operations teams produce their reporting decks. Each deck: 3 to 5 hours of formatting, repeated quarter after quarter. Here's how Paul brings that time to 30 minutes — without sacrificing a single figure.

How much time does quarterly reporting actually consume in your organization? The cumulative calculation is often underestimated:
The time needed to turn a KPI spreadsheet into a brand-compliant deck is rarely measured precisely — yet formatting, charts, and commentary easily absorb half a day to a full day per report.
The ritual repeats four times a year, without exception. No economies of scale, because new data requires new charts and commentary every cycle.
Finance, sales, operations, HR, marketing — each business unit produces its own deck. Multiply by 5 or 10 units.
The cumulative total is often underestimated. At mid-market scale, quarterly reporting mobilizes several person-weeks per year — just to format data that already exists in your systems.
Your KPIs are ready, in your systems. The real work? Turning them into a brand-compliant deck. That's what Paul automates.
Four steps, one ~15-minute initial setup. Subsequent quarters: fully automated.
Excel (most common), CSV, Power BI or Looker exports, or even a PDF accounting statement. Paul recognizes the structure and automatically identifies KPIs (revenue, margin, OPEX, headcount, NPS, etc.).
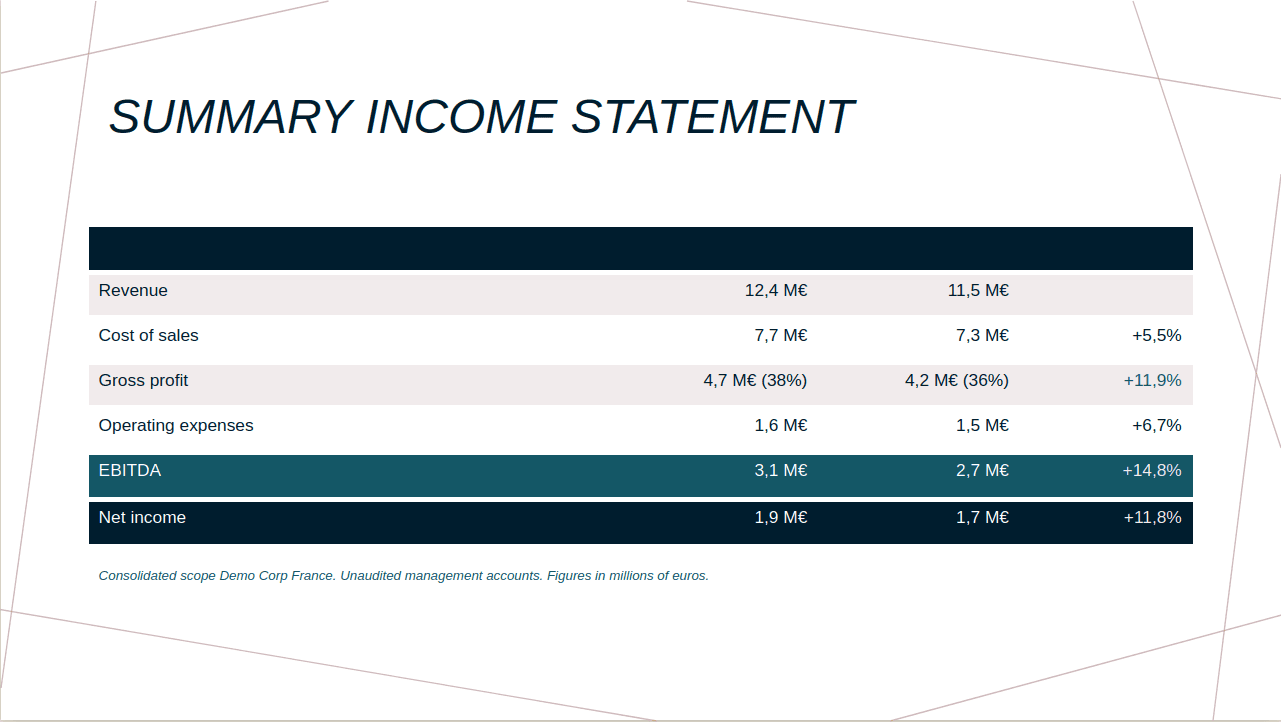
Typical structure: quarterly cover, exec summary (3 key figures), P&L summary, variances vs. prior year and budget, top 3 actions of the quarter, upcoming milestones. You validate or adjust.
Corporate fonts, palette, masters, institutional footer. Figures are preserved to the decimal — Paul recalculates nothing, reinterprets nothing.
You swap the data source (Q3 Excel instead of Q2). Paul reproduces the structure validated the previous quarter. The outline, charts, and commentary templates: automatically adapted to the new data.
A CFO doesn't tolerate approximation. Paul preserves the rigor expected of financial reporting:
Paul displays your figures exactly as they appear in the source. No aggregation, no implicit rounding, no silent transformation. If cell G42 reads £1,247,332, that's what shows in the slide.
Every value displayed in a slide is traceable to its source: row and column number in the original spreadsheet, consolidated source file. You can audit any value in one click.
Paul does not invent a missing data point. If a figure is not in the source, Paul flags it ('Q1 data not provided') instead of filling in an estimate.
Textual analysis ('Growth driven by the ENT segment') is visually distinct from raw figures. The reader always knows what is factual observation and what is interpretation.
Each generated deck is timestamped and retained. In Q+1, you can compare word-for-word with the previous quarter — what changed in the narrative, not just in the numbers.
Paul produces a draft. No deck is distributed automatically — your CFO always retains final control over the published version.
Representative of first months of use in a mid-market context:
The benefit isn't only time saved. It's also visual consistency across business units, and bandwidth freed for higher-value analysis.
Your corporate PowerPoint (official brand guidelines or latest corporate deck). Paul maps fonts, palette, and masters in a few minutes.
Your quarterly management file — whatever the format, Paul adapts. No prior normalization required.
In minutes, you get a complete reporting deck in your template, on your data. Adjust and regenerate as needed.
Natively editable PPTX export. Distribute to your board, executive committee, or directly to your CEO.
30-minute demo: bring a quarterly KPI spreadsheet (anonymized if needed) and your template. We generate your reporting deck live.